When I joined Amazon in 2011, we had about 50,000 people in our operations around the world. Today, we have more than 1.1 million teammates across six continents, and I lead the central organization that focuses on keeping our teams safe every day. Our goal is to be the safest workplace within the industries in which we operate, and we’re continuing to make meaningful progress—thanks to the combined efforts of our more than 9,000 dedicated safety professionals and every one of our employees around the world.
For the past several years, we’ve made a practice of transparently sharing our safety data because it helps us—and hopefully other companies like us—continue to learn and improve. Today, we’re sharing our full-year 2023 data for our operations network, and it shows we’re continuing to make year-over-year progress worldwide.

Here are some key updates from across our global operations:1
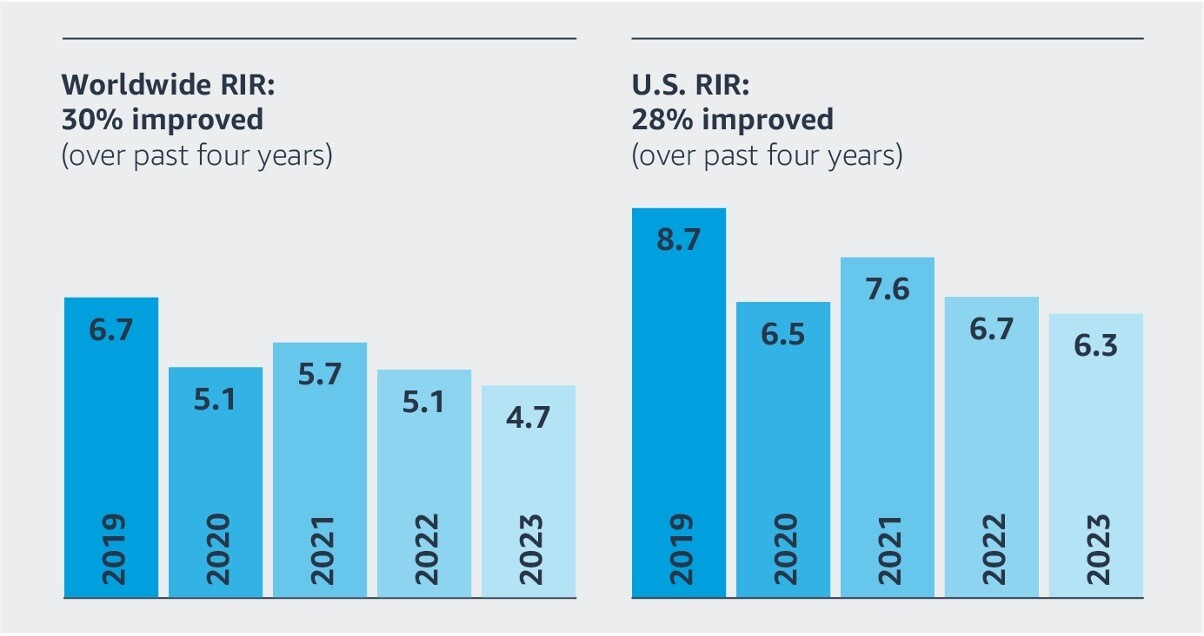
- Our Recordable Incident Rate (RIR)—which includes any work-related injury that requires more than basic first-aid treatment—has improved 30% over the past four years and 8% year over year (YoY).
- Our Lost Time Incident Rate (LTIR)—which includes any work-related injury that requires someone to take time away from work (the most serious injuries)—has improved 60% over the past four years and 16% YoY.
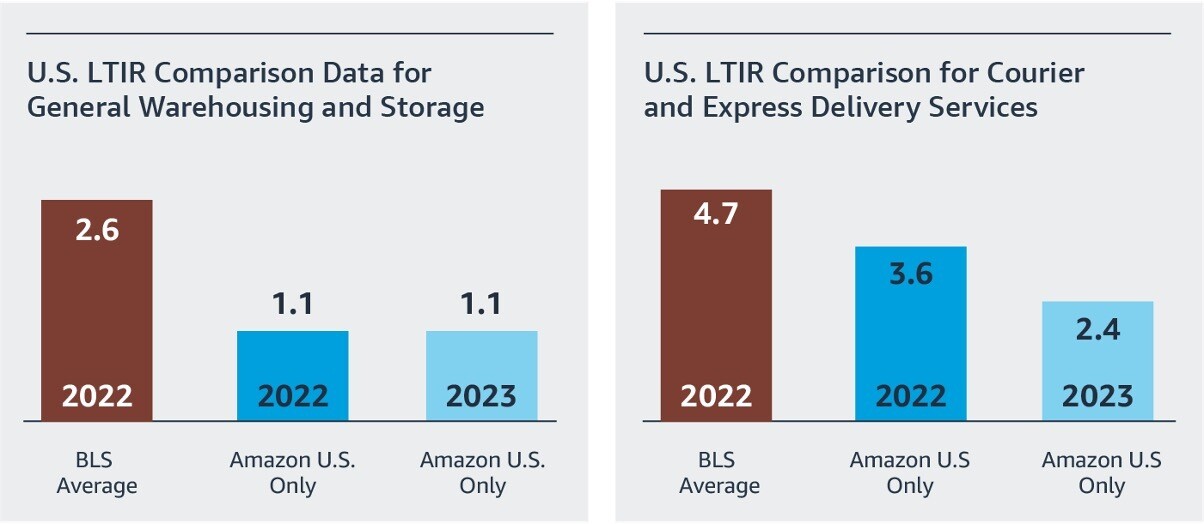
In the U.S., we report our operations data to the Occupational Safety and Health Administration (OSHA) under two distinct industries: General Warehousing and Storage, and Courier and Express Delivery Services. The industry averages for each are determined by the Bureau of Labor Statistics (BLS) based on employers’ size, and BLS categorizes them accordingly. The averages are published each November, meaning the 2022 averages published in November 2023 are the most recent.
Similar to our global operations, we’ve made meaningful, measurable safety progress in the U.S. over the past four years:
- In the General Warehousing and Storage industry:
- Our RIR improved 24% over the past four years. Amazon’s 2023 rate is 6.5, which is better than the latest BLS average of 6.8 for employers our size (>1,000 employees).2
- Our LTIR improved 77% over the past four years. Amazon’s 2023 rate is 1.1, which is better than the latest BLS average of 2.6 for employers our size.
- In the Courier and Express Delivery Services industry:
- Our RIR improved 41% over the past four years. Amazon’s 2023 rate is 6.3, which is better than the latest BLS average of 11.5 for employers our size (250-999 employees).3
- Our LTIR improved 66% over the past four years. Amazon’s 2023 rate is 2.4, which is better than the latest BLS average of 4.7 for employers our size.
As we’ve said in past years, we don’t aspire to be around the average—we want to be the best in the industries in which we operate. We know that every incident number represents a person, which is why one incident is one too many. In 2024 alone, we’ve allocated over $750 million to invest in technologies, resources, training, and programs to further our safety efforts. You can read on to dive a bit deeper into our 2023 safety data, and to learn more about our operations, programs, and progress.
Understanding our operations and workforce
It’s important to understand the basics about our operations and workforce when looking at our data. Globally, our operations network has more than doubled in size since 2019—to more than 1.1 million employees across nearly 5,000 sites. And in the U.S. alone, we've opened more than 570 sites since 2019.
A big part of getting safety right is creating a work culture where every employee feels engaged and empowered to help create and maintain a safe environment. We’ve created a series of feedback mechanisms to ensure we’re listening to our people on the front lines as to how we can improve safety across our operations. One example of how we put their feedback into action is Dragonfly. This tool—available on employees’ devices—lets them easily share safety concerns and suggestions. Their site managers are immediately informed so they can take appropriate action. In 2023 alone, we successfully actioned over 200,000 Dragonfly observations to help make our sites safer.
We also invest heavily in offering competitive pay and benefits, which we know are important parts of helping our team live healthy lives. Our full-time operations employees earn an average hourly wage of over $20.50 and have access to a wide range of benefits—from health care starting day one, to mental health resources, to pre-paid college education and on-the-job training. If you want to learn more about our operations or the range of jobs available at Amazon, you can visit our website or register to take a tour of one of our facilities, which are open to the public.
Evaluating our safety performance
The following graphs illustrate our progress year over year and how we stack up against industry averages. Safety reporting can be complicated, and the raw data can be misunderstood and misrepresented. Learn more about how to interpret Amazon's safety data.


Examining the injuries at Amazon facilities
In addition to looking at overall injury rates, we believe it’s important to look at the types of injuries and how often they occur to help us prevent incidents from occurring in the first place. It’s why we rigorously audit and inspect our sites to make sure our resources and protocols are effectively helping us identify, eliminate, or reduce safety hazards. In 2023, we conducted almost 6.3 million inspections globally, a 152% increase from the 2.5 million conducted in 2020, and we audited 240 sites across Amazon.
These audits and inspections help us determine how to address the various types of injuries. One of the most common injuries at any warehousing or transportation company is what’s called a musculoskeletal disorder (MSD), more commonly known as a strain or sprain. Over the past four years, the rate of MSD Recordable Incident Rates at Amazon has improved 27%, but they still make up about 57% of all recordable injuries at Amazon. The remaining 43% of our recordable injuries were due to slips, trips, and falls or occasional objects that came loose and fell.
To continue reducing MSD injuries, we’ve devoted considerable effort and resources to improve ergonomic conditions. In 2023, we invested in technology and workspace modifications that specifically target MSD risk reduction. For example, we:
- Introduced sophisticated computer algorithms in our fulfillment centers that direct employees to pick and stow products in ergonomic power zones—the area between the shoulder and mid-thigh. As a result, there was an average 5% improvement in the cumulative forces acting on the lower back, and an average 7% on the shoulder.
- Implemented adjustable height workstations at select fulfillment centers.
- Deployed ergonomically redesigned packing stations at specific fulfillment centers.
- Introduced self-adjusting carts that enable employees to handle totes (plastic bins used to move products) in an ergonomically friendly way.
We’re committed to continuing to improve ergonomics across our operations, and it will be a large focus of our 2024 safety investment.
Investing in safety improvements

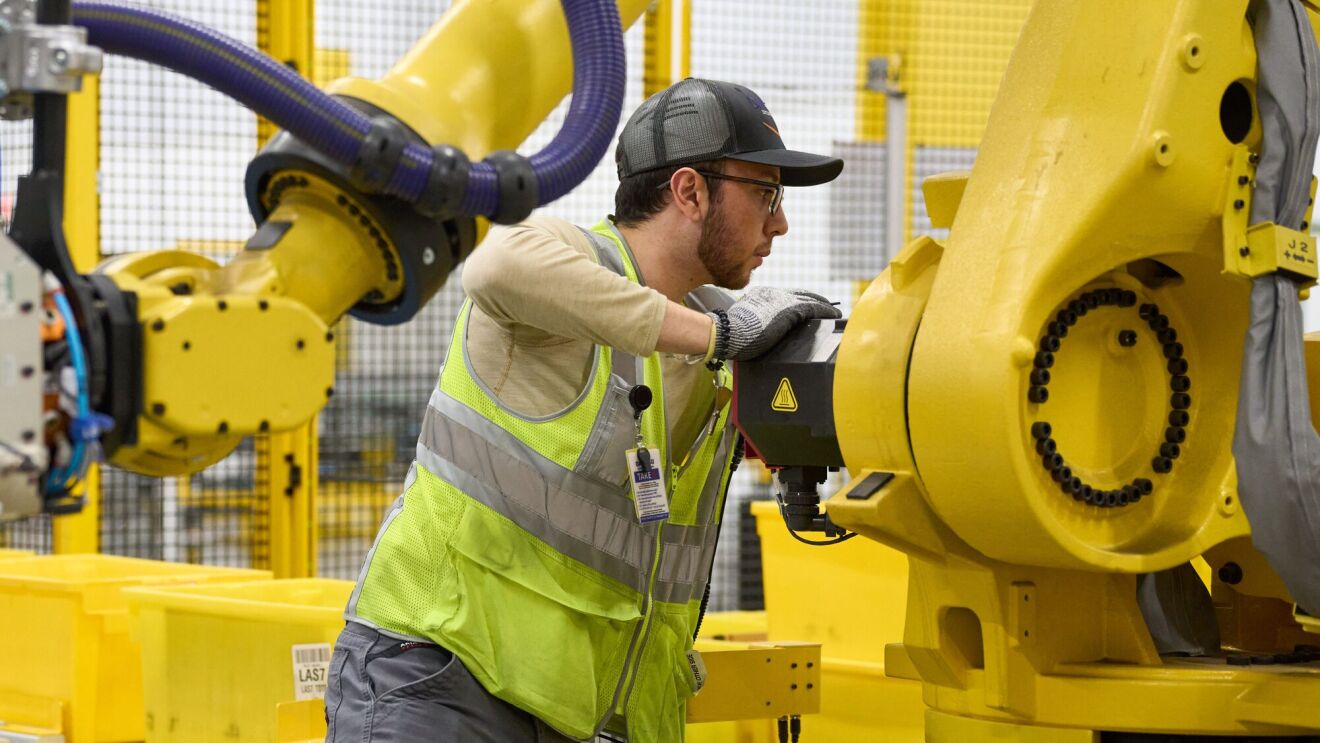
The progress shown above is the result of investments of more than $1 billion in safety initiatives, technologies, and programs since 2019. We’ve also continued to invest in our robotics that help make our operations safer by reducing employees’ workload. One example is Proteus, our first autonomous mobile robot, that helps move heavy objects and carts. Another is Cardinal, a robotic arm that can quickly select a single package, read its label, and sort it. Both innovations help reduce repetitive tasks that can cause injuries like MSDs, and create a safer, more comfortable work environment for our employees all year long. We also plan for factors that can impact our employees’ safety such as extreme weather. Our policies and procedures for addressing extreme heat and cold are robust and often exceed industry standards and guidelines.
As we look to the future, we plan to continue investing heavily in safety across our operations. And in 2024 alone, we plan to invest over $750 million in things like:
- Over $400 million for process engineering and retrofit initiatives that further improve ergonomics
- Over $150 million in additional fork truck safety controls
- Over $100 million for on-the-road safety enhancements
- Over $80 million for truck yard safety improvements
Working with our operations partners
Within our operations network, we also work with partners around the world to deliver packages to our customers safely and efficiently. For example, we work with small business owners called Delivery Service Partners (DSPs) and independent contractors called Amazon Flex delivery partners to deliver packages to customers’ doorsteps. We also work with independent, long-haul trucking companies to move products across our network.
While our partners report their own safety data to regulators, we’re committed to helping them keep their employees safe, and we offer them access to safety resources, training, and technologies. One example is third-party technology in delivery vans that measures and monitors unsafe driving behaviors such as speeding, distraction, and failure to wear a seat belt or obey a road sign. If these behaviors are consistently detected, drivers receive a notification when they stop their vehicle for their next delivery. Related notifications are also sent to the drivers’ employer—the DSPs—who are encouraged to coach the driver.
Since we’ve incorporated this technology into our branded vehicles, DSP drivers’ collision rates have declined nearly 40%, and from 2022 to 2023, it reduced unsafe driving behaviors by 62% in the U.S.
Looking ahead
2023 was a year of meaningful, measurable progress, and we’re working hard to build on that this year because while we have improved, we are not satisfied. We want to thank our teams around the world for their commitment to safety, and for their feedback throughout the year that helps us continue to get better, together.
1. All of these numbers and other comparisons in this post are based on the rates we’ve reported to applicable regulators or are otherwise derived from the same tracking systems used for that reporting.
2. In the General Warehousing and Storage industry, Amazon benchmarks itself against the industry average for employers with >1,000 employees because the average number of employees at sites reporting into that code is more than 1,400.
3. In the Couriers and Delivery Services industry, Amazon benchmarks itself against the industry average for employers with 250-999 employees because the average number of employees at sites reporting into that code is more than 290.
Trending news and stories
- Tour the Amazon-backed seaweed farm working to turn kelp into a carbon-cutting superhero
- How to watch ‘The Runarounds’ on Prime Video
- Amazon now offers same-day perishable grocery delivery in over 1,000 cities and towns with plans to double that reach by year's end
- Watch a teaser for the upcoming K-drama ‘Confidence Queen,’ starring Park Min-young, on Prime Video


